Monthly Archives: March 2012

by

Frontier Currencies Irresistible as Naira Yields More

No comments yet

Categories: Forex Capital Today, News Flash - Market Movements, Tags: , , ,

Hello Investors,readers,

Interesting article I read the other day about interest rates and how the money flows towards alternative markets to achieve higher yield on the investment capital.

Foreign-exchange traders, faced with lower volatility and record-low interest rates in the U.S., Europe, the U.K. and Japan, are searching for returns as far afield as Kazakhstan and Nigeria.

Investec Asset Management Ltd., which trades currencies of nations from Colombia to Uganda, said demand for assets in so- called frontier markets increased in the past six months. The Cambridge Strategy (Asset Management) Ltd. invested in the Nigerian naira from December to February. Money manager Adrian Lee & Partners will add positions in six currencies, including Kazakhstan’s tenge and the Kenyan shilling by the end of the second quarter.

Investors are pouring cash into countries rich in commodities or with high growth rates after Europe’s debt crisis prompted them to seek the safety of the dollar and the yen in 2011. Kenya’s shilling is up 29 percent since October from a record low and Chile’s peso has advanced 6.2 percent against the dollar this year. Now, traders risk central-bank action to counter currency appreciation as nations become overwhelmed by a market that dwarfs their economies.

“We have seen an increase in demand and interest in frontier currencies and emerging market currencies versus the majors,” Thanos Papasavvas, head of currency management in London at Investec, which oversees about $88 billion, said in a March 21 phone interview. “It’s not just a search for yield that has led to the increase in demand for these currencies, it’s also about stronger and improving fundamentals and better valuations.”
Colombian Rally

Investec trades the currencies of Chile, Colombia, Kazakhstan, Kenya, Nigeria, Pakistan, Sri Lanka, Uganda, Ukraine, Vietnam and Zambia, Papasavvas said.

Colombia, where mining helped the economy expand 5.9 percent last year and the benchmark interest rate is 5.25 percent, saw its peso strengthen more than 10 percent this year, tied with Poland’s zloty for the most among more than 170 currencies tracked by Bloomberg.

Its government said last month it will keep at least $1 billion of dividends from state-run oil producer Ecopetrol SA abroad to avoid adding to gains in the peso. It doesn’t rule out further steps to curb currency strength, Finance Minister Juan Carlos Echeverry told reporters in Bogota March 20.
‘Destabilizing’ Flows

Countries from Brazil to Switzerland have already taken steps to weaken exchange rates to protect exports and domestic industry. Brazil, Latin America’s largest economy, has sold dollars and broadened taxes on foreign loans and bonds issued outside the nation as part of measures to shield the real from foreign inflows. The Swiss National Bank introduced a cap of 1.20 francs per euro in September to limit its strength.

“Short-term capital flows can be destabilizing and I wouldn’t be surprised to see more countries fight that,” Dale Thomas, head of currency management in London at Insight Investment Management Ltd., which oversees about $267 billion in assets, said in a telephone interview on March 19. “You can get an asset bubble when money flows in and when money flows out it collapses.”

Investment is being channeled into alternative markets as profits from the largest currencies prove harder to come by. Deutsche Bank AG’s gauge of foreign-exchange returns, which includes the most-actively traded currencies, slipped 0.3 percent this year after a 3.8 percent drop in 2011, the worst performance in two decades. The currency-returns index had climbed 47 percent over seven years ended Dec. 30, 2005.
Falling Volatility

The JPMorgan G7 Volatility Index (JPMVXYG7) has tumbled to 10.14 percent from 15.46 percent in September, reducing money managers’ ability to exploit price moves. The 3.5-cent difference between the euro’s high this month of $1.3357 and its low at $1.3004 is the narrowest trading band since July 2007. The shared currency traded at $1.3228 at 11:59 a.m. in New York today.

Optimism that Europe’s debt crisis is stabilizing after the European Central Bank boosted bank liquidity with about 1 trillion euros ($1.3 trillion) of three-year loans and private investors forgave more than 100 billion euros of Greek debt has boosted demand for higher-yielding assets such as stocks. The Stoxx Europe 600 Index (SXXP) has climbed 8.6 percent this year.

Low rates, austerity and stimulus measures in the U.S., the U.K., Europe and Japan — known as the G-4 — have strategists forecasting little change.

The euro will fall to $1.30 by year-end, the median estimate of more than 50 strategists surveyed by Bloomberg shows. The yen will trade at 83 per dollar by year-end from 82.65 today and Britain’s pound will be at $1.57, from $1.5869, separate surveys show.
Emerging-Market Volumes

Futures-trading data from CME Group Inc., the world’s largest futures exchange, shows that volumes in emerging-market currencies jumped 42 percent in 2011 from the prior year, while those in the yen, euro and Swiss franc stagnated.

“There clearly has been more activity in the emerging markets — there are greater opportunities for investors,” said Ed Baker, executive chairman of London-based The Cambridge Strategy, which specializes in emerging-market currencies and equities and has $850 million under management. “No doubt it has been harder with the G-4 to make money,” he said in a March 20 telephone interview.

Baker said his company has profited in Nigeria’s naira and the United Arab Emirates dirham, while Serbia’s dinar was the best-performing currency in 2011 in its $65 million Apollo strategy fund, which had gross returns of 15.9 percent on an annualized basis since it was set up in May 2009.

Trade safe

Erik

Source: Bloomberg – Emma Charlton and Paul Dobson on March 26, 2012

by

All Central Bank Balance Sheets Are Exploding Higher!

No comments yet

Categories: News Flash - Market today, Tags: , , ,

All Central Bank Balance Sheets Are Exploding Higher, Or Engaged In QE

The degree to which central banks around the world are printing money is unprecedented.

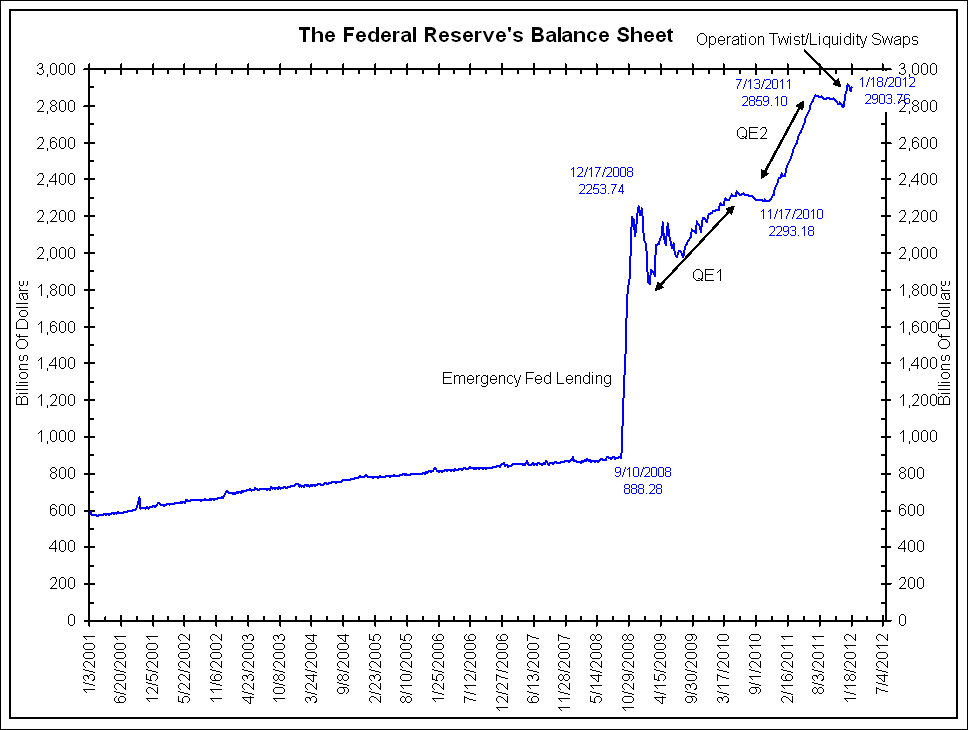
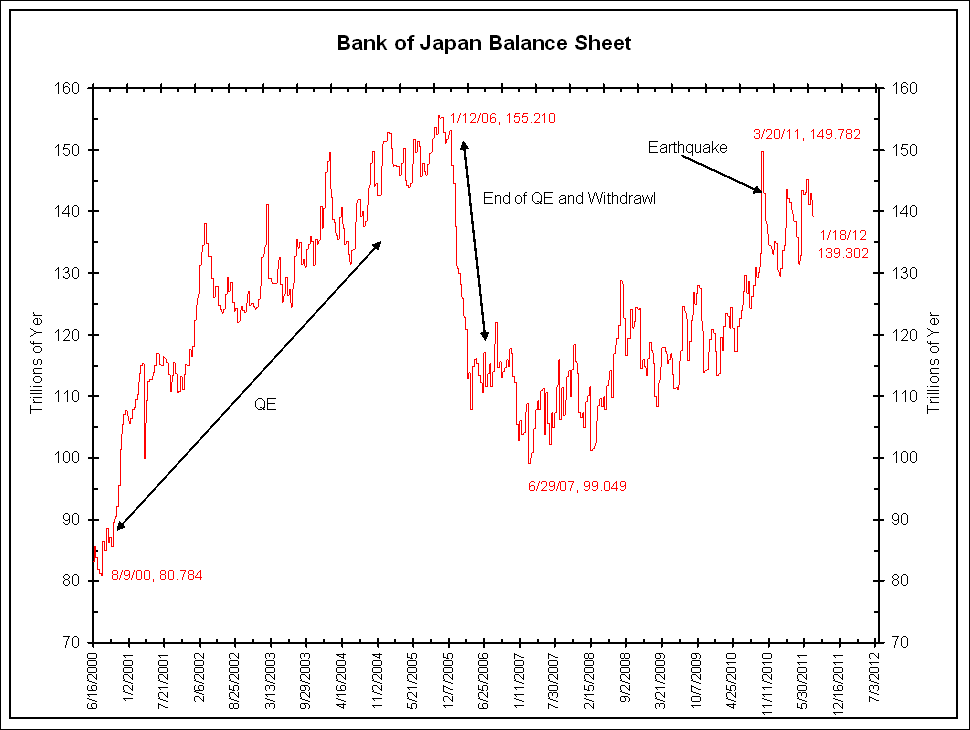
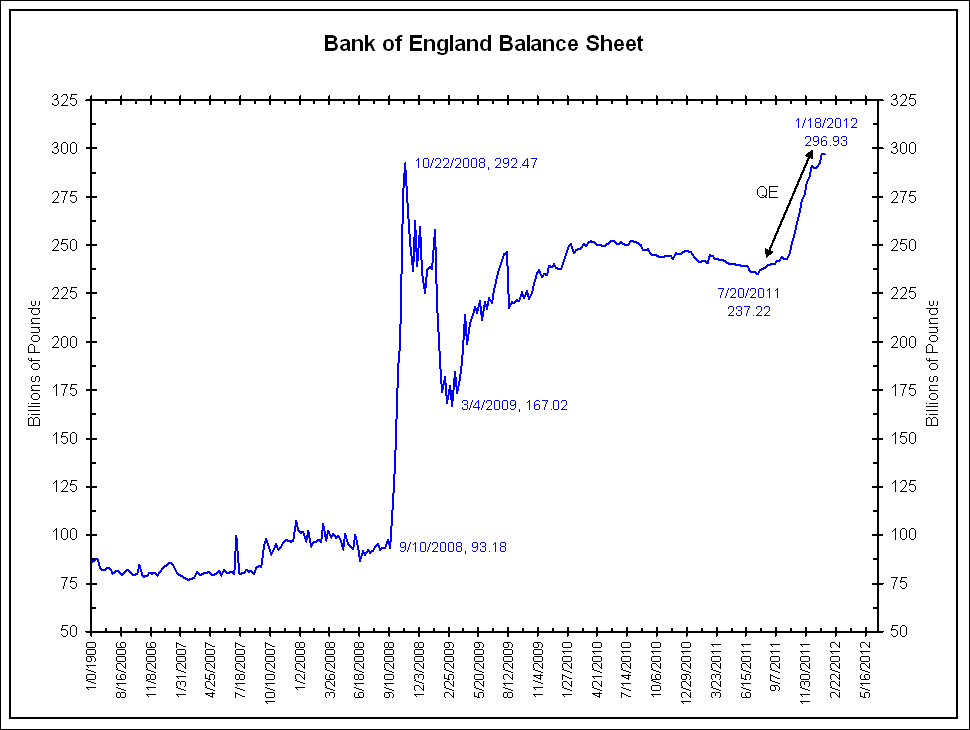
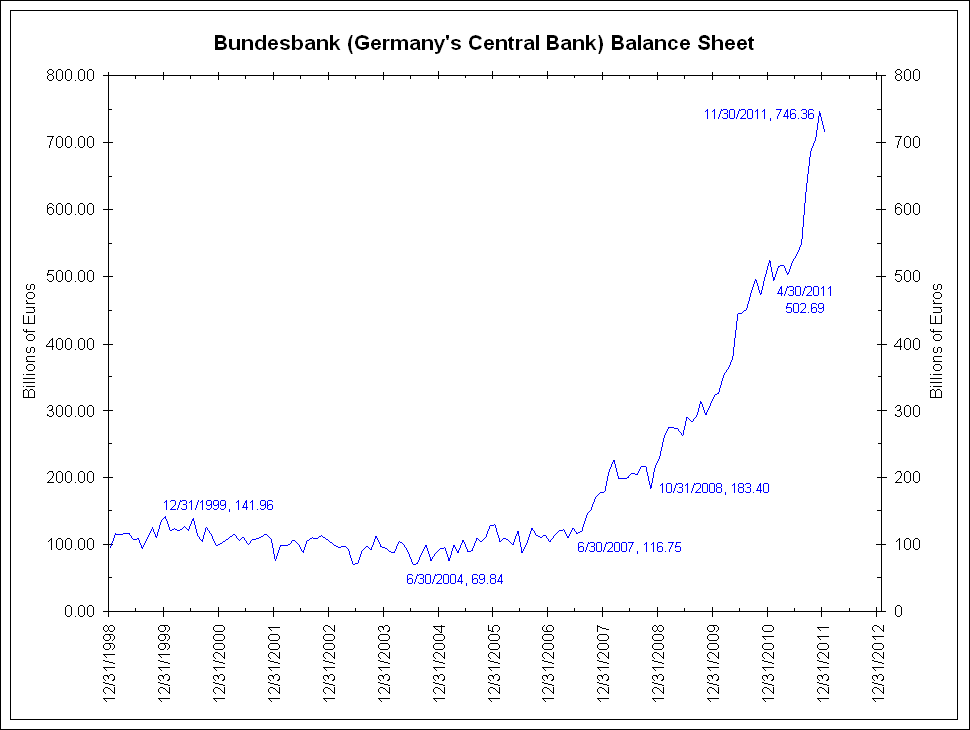
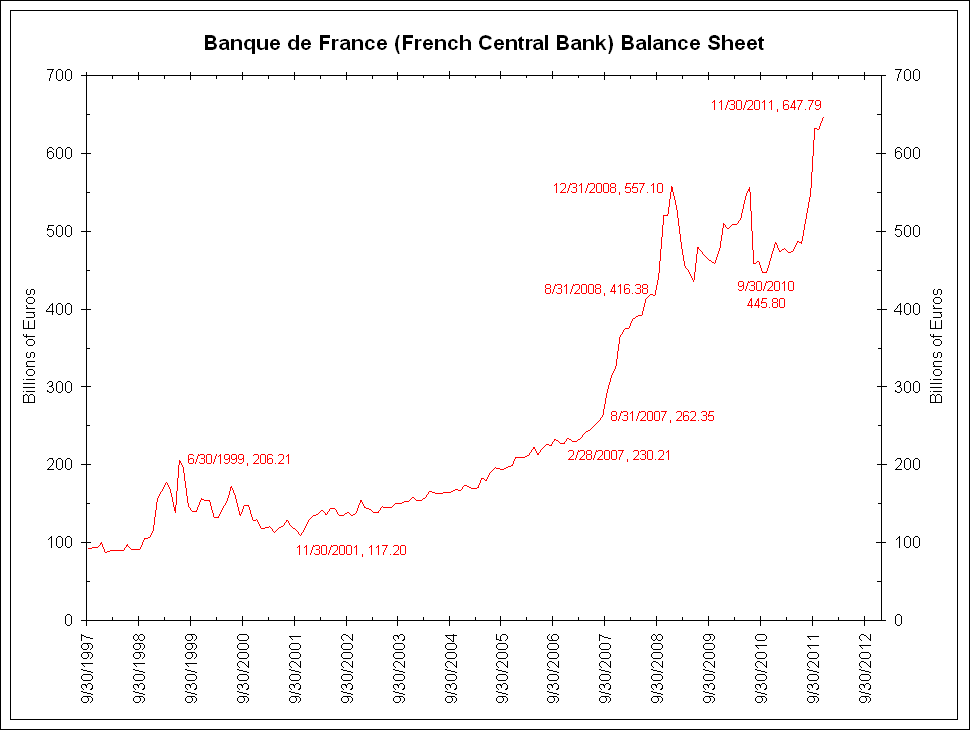
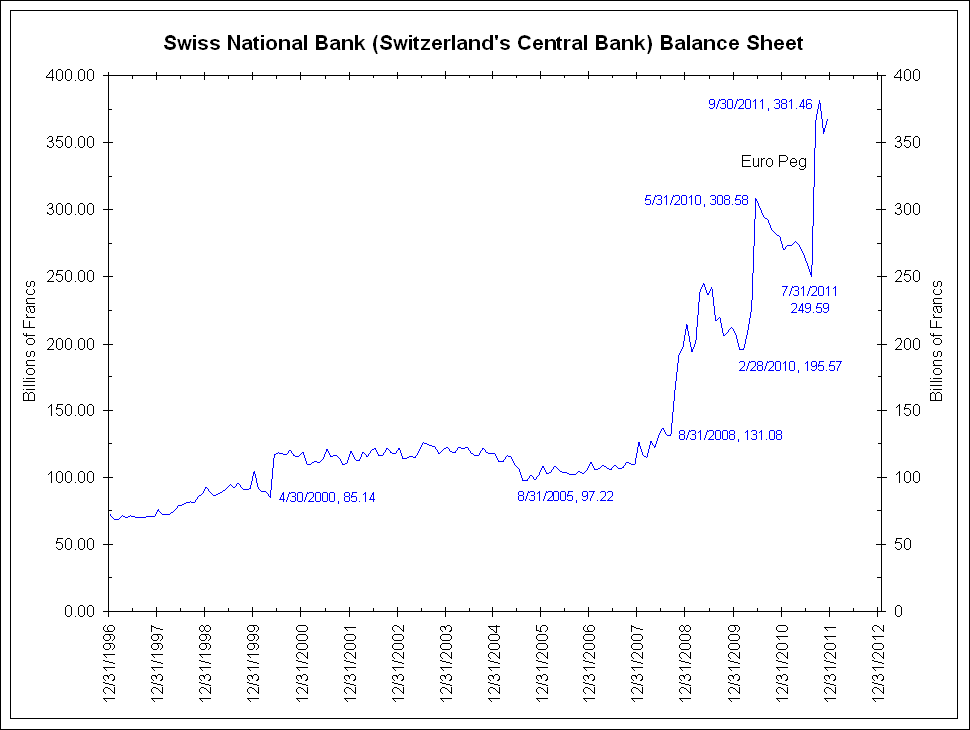
The first eight charts below show the balance sheets of the largest central banks in the world. They are the European Central Bank (ECB), the Federal Reserve (Fed), the Bank of Japan (BoJ), the Bank of England (BoE), the Bundesbank (Germany), the Banque de France, the People’s Bank of China (PBoC) and the Swiss National Bank (SNB).  Noted on the charts are significant events or growth rates.

Shown is the size of each respective balance sheet in its local currency.  Note that all are exploding higher as every chart goes from the lower left to the upper right.  Most are still making new all-time highs. If the basic definition of quantitative easing (QE) is a significant increase in a central bank’s balance sheet via increasing banking reserves, then all eight of these central banks are engaged in QE.


Click to enlarge:

˜˜˜


Comparing Central Bank Balance Sheets

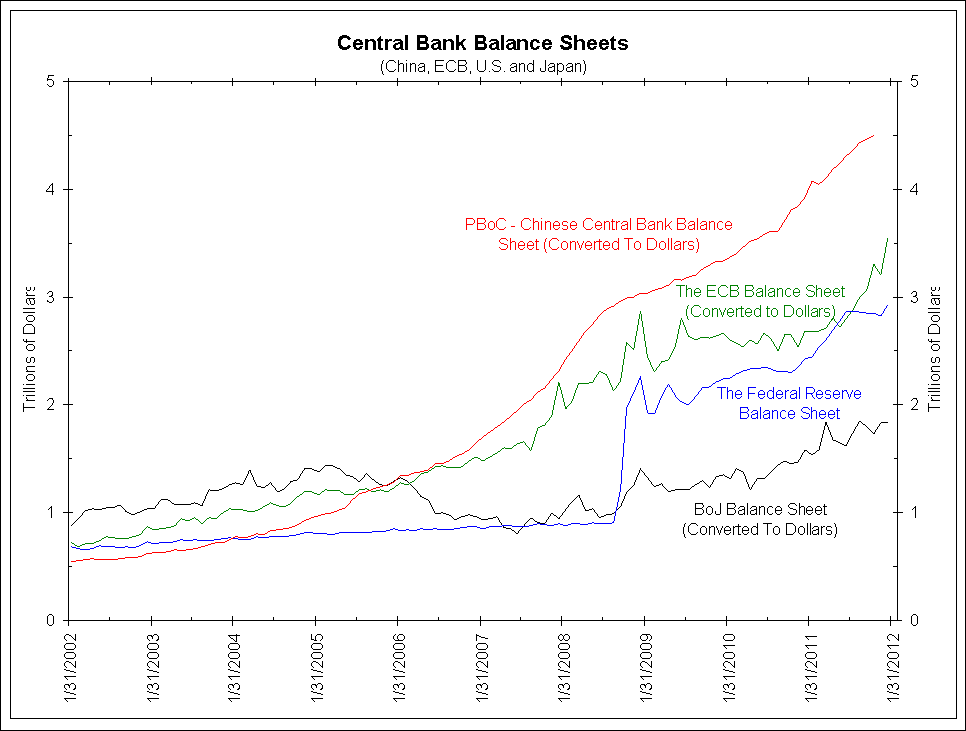
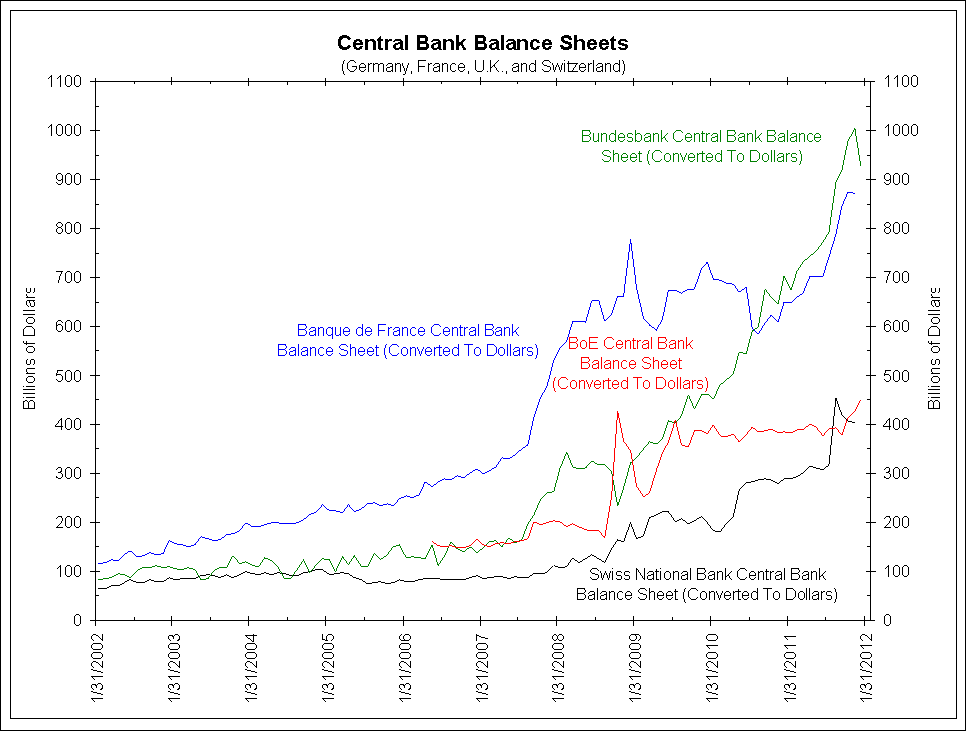
For comparison’s sake, we converted the eight balance sheets above into dollar terms.  The four largest, the PBoC, the Fed, the BoJ and the ECB are shown in the first chart below.  The second four, the Bundesbank, Banque de France, the BoE and SNB are shown in the second chart below.   We split them up because of their vastly different scales.

In the first chart, note that the balance sheets of the PBoC and the ECB are larger than the Federal Reserve when converted to dollars.  The BoJ used to be the largest balance sheet in dollar terms until 2006.

When shown in dollar terms below, the Bundesbank is the largest of the “second four” central banks.  Further, its growth rate over the last five years has been among the highest.  This is surprising since the Bundesbank is considered the “hard money” central bank.

Combining Central Bank Balance Sheets

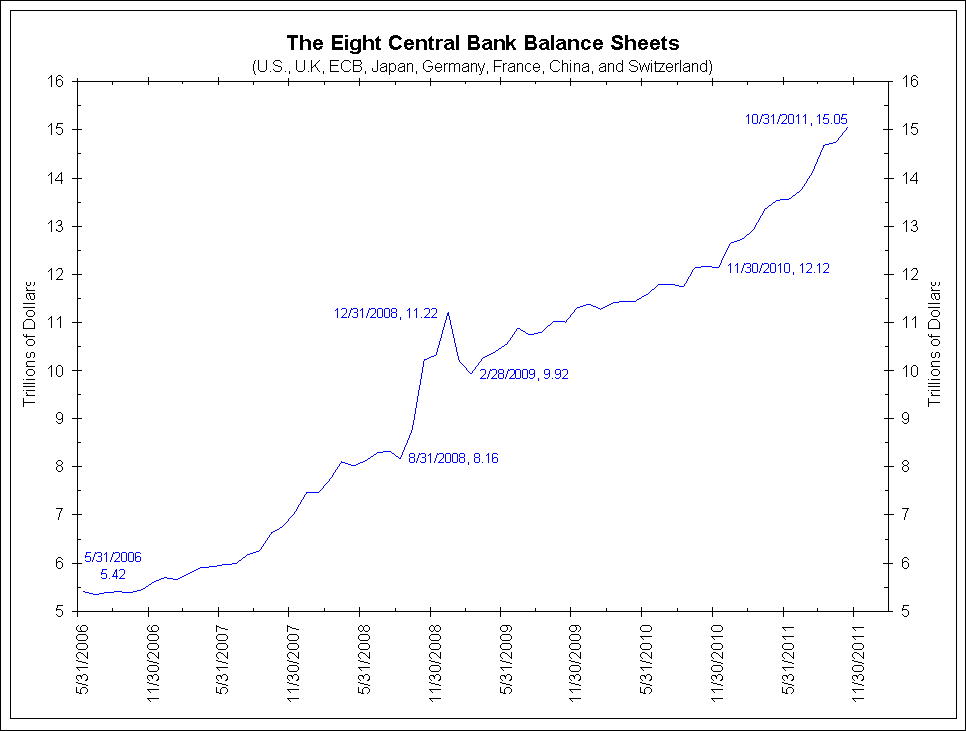
The next chart below adds up the eight largest central bank balance sheets in dollar terms.  It is only current through October as that is the latest number from the PBoC.

The combined size of these eight central banks’ balance sheets has almost tripled in the last six years from $5.42 trillion to more than $15 trillion and is still on the rise!

Central Banks Equal To One-Third Of World Equity Values

As noted above, QE is an expanding of balance sheets via increasing bank reserves.  The purpose of QE, as explained by this Bank of England video,  is to increase bank reserves through purchases of fixed income securities in order to lower interest rates.  This makes fixed income securities relatively unattractive/overvalued and pushes investors out the risk curve.  This should increase buying for riskier assets such as stocks, pushing them higher in price.  Theoretically these higher prices should lead to a wealth effect and increased economic activity.

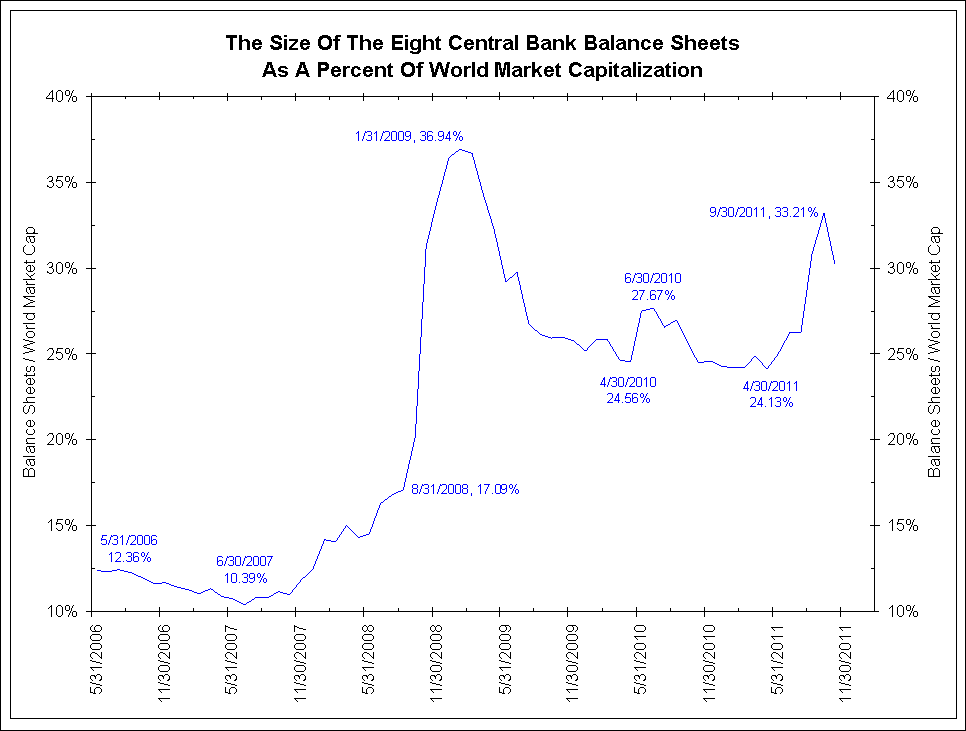
Given this definition and purpose, it is fair to compare the size of these balance sheets (now $15 trillion) to the capitalization of the world’s stock markets (now $48 trillion).  This is shown in the chart below.

Prior to the 2008 financial crisis, the eight central bank balance sheets were less than 15% the size of world stock markets and falling.  In the immediate aftermath of Lehman Brothers’ failure, these eight central bank balance sheets swelled to 37% the capitalization of the world stock market.  But keep in mind that the late 2008/early 2009 peak was due to collapsing stock market values combined with balance sheet expansion via “lender of last resort” loans.

Recently, the eight central bank balance sheets have spiked back to 33% of world stock market capitalization.  This has come about not by lender of last resort loans, but rather by QE expansion (buying bonds with printed money) even faster than world stock markets are rising.

What Does It All Mean?

2011 was so difficult because all stocks seemingly moved together.  It was as if every S&P 500 company had the same chairman of the board that knew only one strategy, resulting in a high degree of correlation between seemingly unrelated companies.

Massive central bank involvement in the markets risks returning us to a de facto centrally planned economy. Those S&P 500 companies all have the same chairman; it is Ben Bernanke because his policies are affecting everybody. That is what makes money management so difficult. Correlations will ebb and flow; they always do. But what makes them go away? This will only happen when governments and central banks go away.

But if they go away, then does that not mean things get ugly? Maybe they do get ugly, but it also means that we sort out the excesses in the market. We reward the people that do the right thing and we punish the people that do the wrong thing. And we have an adjustment process that may be ugly, but then we have a period of long expansion.

Central banks are ruling markets to a degree this generation has not seen.  Collectively they are printing money to a degree never seen in human history.

So how does this process get reversed?  How do central banks pull back trillions of dollars of money printing without throwing markets into a tailspin?  Frankly, no one knows, least of all central banks as they continue to make new money printing records.

Until a worldwide exit strategy can be articulated and understood, risk markets will rise and fall based on the perceptions and realities of central bank balance sheets.  As long as this is perceived to be a good thing, like perpetually rising home prices were perceived to be a good thing, risk markets will rise.

When/If these central banks go too far, as was eventually the case with home prices, expanding balance sheets will no longer be looked upon in a positive light.  Instead they will be viewed in the same light as CDOs backed by sub-prime mortgages were when home prices were falling.  The heads of these central banks will no longer be put on a pedestal but looked upon as eight Alan Greenspans that caused a financial crisis.

The tipping point between balance sheet expansion being bullish for risk assets versus bearish is impossible to know.  Given the growth rate of central bank balance sheets around the world over the past few years, we might not have to wait too long to find out.  Enjoy it while it is still bullish.

Future will show where the giant ship is heading, stay tuned and trade safe.

Erik

Source: Bianco Research


by

History seems to repeat endless again – Housing Prices Again !!

No comments yet

Categories: News Flash World Economy, Tags: ,

In late 2009, just a few months before the 2010 spring selling season for homes got underway, the Philadelphia Housing Sector Index (HGX) started to move. The benchmark index of housing and construction-related stocks surged from around 90.55 in November to 132.53 in late April — a gain of 46 percent.

Investors and pundits hailed it as proof positive that the housing market was finally on the mend … that blue skies and rainbows were here to stay! But what happened next? The index flopped and chopped around for a while … then fell off the table. Ultimate loss through October for anyone who bought the hype? 39 percent!

In late 2010, just a few months before the 2011 spring selling season, it happened again! The HGX rallied from 94 in late November to 121 in late February — a rise of 29 percent.

So did THAT signal a lasting turn for the housing market’s fortunes? Er … no! The index imploded 34 percent shortly thereafter.

And wouldn’t you know it? Investors are at it again!

They’ve been buying housing stocks, construction stocks, home improvement retailers, cabinet and faucet makers, paint companies, and more like they’re going out of style!

Stocks like Valspar (VAL), Sherwin-Williams (SHW), Stanley Black & Decker (SWK), A.O. Smith (AOS), Masco (MAS), Home Depot (HD) are putting even high-momentum Internet companies to shame with their recent gains!

Me? I can’t shake the feeling it’s déjà vu all over again — and that the 2012 version of this annual rite is going to end badly too!

What the latest housing figures do —
and DON’T — show

Why is there so much optimism about these stocks and the housing market in general? I don’t know if it’s the fact it’s 80 degrees in Chicago and New York City. I don’t know if it’s just the innate optimism that prevails on Wall Street, or the happy talk from housing company executives.

But whatever it is, it sure doesn’t seem justified to me. We have undoubtedly seen some improvement from the depths of the 2007-2009 recession. Home sales, home construction activity, and builder optimism have taken a modest turn for the better.

But even with that slight improvement, housing starts remain a whopping 69 percent below their bubble peak! A key measure of home builder optimism is still down 61 percent. Existing home sales? They’re off 37 percent. Home prices? Down 34 percent … STILL!

More recently, we’ve seen mortgage rates shoot higher along with Treasury yields. That couldn’t come at a worse time, considering we’re entering the heart of the home selling season. Is that why the National Association of Home Builders confidence index just registered 28 in March, instead of rising to 30 as expected? Hmmm.

And what about housing starts? They slumped slightly to 698,000 in February instead of rising as expected. Moreover, single-family starts plunged 9.9 percent — the biggest drop in a year!

“Look out below” time for housing sector?
Sure looks like it to me!

Long story short: It’s been a heck of a rally in the housing and construction sector. Some sector stocks are trading at all-time highs. Not 52-week highs, mind you. Highs they didn’t even hit during the peak of the bubble — when home prices were rising at double-digit rates and construction activity was running at the fastest rate in U.S. history!

Does that make sense to you? Because it sure doesn’t to me!

In fact, I believe the combination of that strong rally … the recent rise in interest rates … and the potential for activity to slow going forward will prove toxic to investors. If you own these stocks and have enjoyed the rally, I urge you to sell now.

I would also take gains off the table in other stock market sectors. If the recent housing strength fades, the economy will likely cool, and I don’t believe the broad market is prepared for that.

Until next time and good trading,

Erik